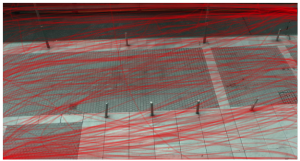
The technique visualises pedestrian traffic and can show walking direction, speed, and path curvature.
In June 2014, I will present the results of my paper on an evaluation method for evaluating displays in public spaces. The proposed evaluation technique brings together observational research techniques from sociology with social signal processing to automatically generate behavioural maps of public display usage. This technique can be used in a variety of contexts to evaluate many different kinds of public displays and is non-intrusive and non-disruptive to the interaction being evaluated. Another interesting aspect of this approach is that it can capture both interacting users and non-interacting or avoiding passers-by. Upon publication, all of the data and code used in the paper will be made openly available.
Abstract: This paper presents a powerful approach to evaluating public technologies by capturing and analysing pedestrian traffic using computer vision. This approach is highly flexible and scales better than traditional ethnographic techniques often used to evaluate technology in public spaces. This technique can be used to evaluate a wide variety of public installations and the data collected complements existing approaches. Our technique allows behavioural analysis of both interacting users and non-interacting passers-by. This gives us the tools to understand how technology changes public spaces, how passers-by approach or avoid public technologies, and how different interaction styles work in public spaces. In the paper, we apply this technique to two large public displays and a street performance. The results demonstrate how metrics such as walking speed and proximity can be used for analysis, and how this can be used to capture disruption to pedestrian traffic and passer-by approach patterns.